
In the first week of June, 1 in 5 Tweets about traffic, delays and congestion by people around the Washington Beltway were caused by John Oliver’s segment on Net Neutrality.
Here at Savi we are exploring a wide range of sensors to obtain useful insights that can used to make work and routine activities faster, more efficient and less risky. One of our Alpha Tests is examining use of “arrays” of high-targeted Twitter sensors to detect early indications of traffic congestion, accidents and other sources of delays. Specifically we are training our system how to use Twitter is a good traffic sensor (by good, in “data science speak” we are determining whether we can train a model for traffic detection that good precision and recall). To do this, we setup a test bed around the nation’s second-worst commuter corridor: the Washington DC Beltway (our own backyard at Savi).
Earlier this month our Twitter “Sensor Array” picked up an interesting surge in highly localized tweets about traffic-related congestion and delays. This was not an expected “bad commuter-day”-like surge. The number of topic- and geographically-related tweets seen on June 4th was more than double the expected number for a Tuesday in June around the Beltway; the number seen during lunchtime was almost 5x normal.
So what was the cause? Before answering, it is worth taking a step back.
The folks at Twitter have done a wonderful job at not only allowing you to fetch tweets based on topics, hash tags and geographies. They have also added some great machine learning-driven processing to screen out likely spammers and suspect accounts. Nevertheless Twitter data, like all sensor data, is messy. It is common to see Tweets with words spelled wrong, words used out of context, or simply nonsensical Tweets. In addition, people frequently repeat the same tweets throughout the day (a tactic to raise social media exposure) and do lots of other things that you must train the machine to account for.
That’s why we use a “Big Data” Lambda Architecture model to process all of our streaming sensor data. Not only do we apply rules in real-time (a.k.a. Complex Event Processing) to detect patterns as they happen; we also keep a permanent copy of all raw data that we can explore to discover new patterns and improve our machine learning models).
That is exactly what we did as soon as we detected the surge. Here is what we found: the cause of the traffic- and congestion-related Twitter surge around the Beltway was… John Oliver:
- At 11pm EDT on June 1 on the “Last Week Tonight”, John Oliver had an interesting 13-minute segment on Net Neutrality. In this segment he encouraged people to visit the FCC website and comment on this topic.
- Seventeen hours later, the FCC tweeted that “[they were] experiencing technical difficulties with [their] comment system due to heavy traffic.” They tweeted a similar message 74-minutes later.
- This triggered a wave of re-tweets and comments about the outage in many places. Interestingly this wave was delayed in the Beltway. It surged the next day, just before lunchtime in DC, continuing throughout the afternoon. The two spikes were at lunchtime and just after work (evidently, people are not re-tweeting while working).
- By 4am on Wednesday the surge was over. People around the Beltway were back to their normal tweeting about traffic, construction, delays, lights, outages and other items confounding their commute.
Of course, as soon as we saw the new pattern, we adjusted our model to account for this pattern. However, we thought it would be interesting to show in a simple graph how much “traffic on traffic, delays and congestion” Mr. Oliver induced in the geography around the Beltway for a 36-hour period. Over the first week of June, one out of every five Tweets about traffic, delays and congestion by people around the Beltway were not about commuter traffic, but instead around FCC website traffic caused by John Oliver:
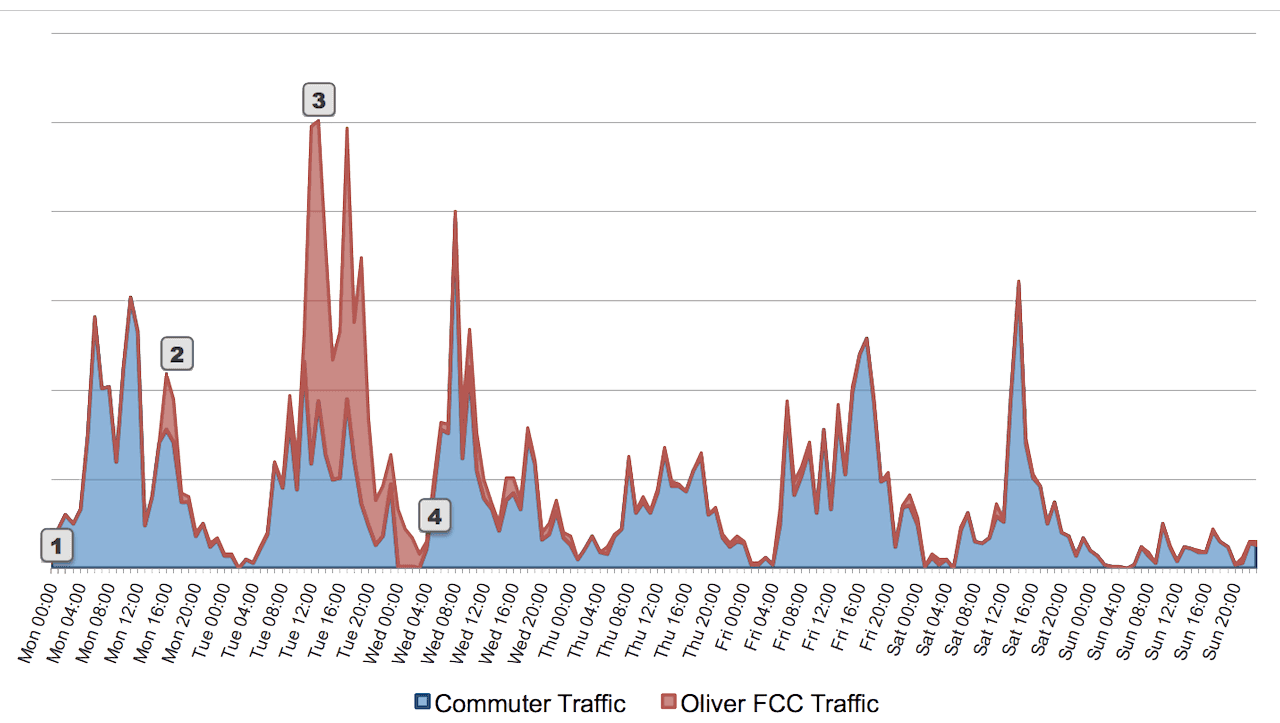
Tweets from people geographically Tweeting around the Washington Beltway on traffic, congestion, delays and related frustration for first week of June. (Click to enlarge.)
Obviously, a simple count of tweets is a gross measure. To really use Twitter as a sensor, one needs to factor in many other variables: use text vs. hash-tags, tweets vs. mentions and re-tweets, the software client used to send the tweet (e.g., HootSuite is less likely to be a good source for accurate commuter traffic data); the number of followers the tweeter has (not a simple linear weighting) and much more. However, the simple count is simple first-order visualization. It also makes interesting “water-cooler conversation.”